
GHG Accounting & Decarbonisation:
Holland Brew Group B.V.

From Theory to Practice: GHG Accounting (Scopes 1–3)
This project applies the technical foundation gained through my GHG Accounting (Scopes 1–3) certification to a practical, end-to-end carbon accounting exercise. The objective was to transform raw, unstructured data into a robust carbon inventory fully aligned with the GHG Protocol.
This project enhanced my practical understanding of GHG Protocol implementation, end-to-end data modeling, and carbon reduction strategy formulation.
Key Skills Applied:
GHG Protocol (Scopes 1–3) accounting · Excel (VLOOKUP, CONCAT, SUMIF, Power Query) · Power BI (dashboard development, DAX) · Science-Based Target (SBTi) alignment · Graphic Communication
Data Workflow:
Raw Data (Excel) → Power Query → Power BI DAX Modeling → Interactive Dashboard
Dataset:
You can download the full inventory file for a detailed view of the calculation logic and emission factor mapping.
Company Profile: Holland Brew Group B.V.

Holland Brew Group B.V. is a fictional Netherlands-based coffee and tea wholesaler and roaster created for this GHG accounting practice project. The model reflects a vertically integrated value chain spanning global sourcing, roasting, and distribution across retail and B2B markets.
The organisational boundary follows the operational control approach under the GHG Protocol. The inventory includes 100% of Scope 1 and 2 emissions from facilities under full control (F001–F006, F009–F016), plus relevant Scope 3 emissions. Joint ventures (F007–F008) are excluded from Scope 1–2 to prevent double counting; instead, 50% of their emissions are reported under Scope 3, Category 15 (Investments).
As this is a technical demonstration project establishing a 2024 industrial baseline, FLAG (Forest, Land and Agriculture) emissions from coffee production are excluded due to data limitations.
A Logical Approach to Carbon Accounting
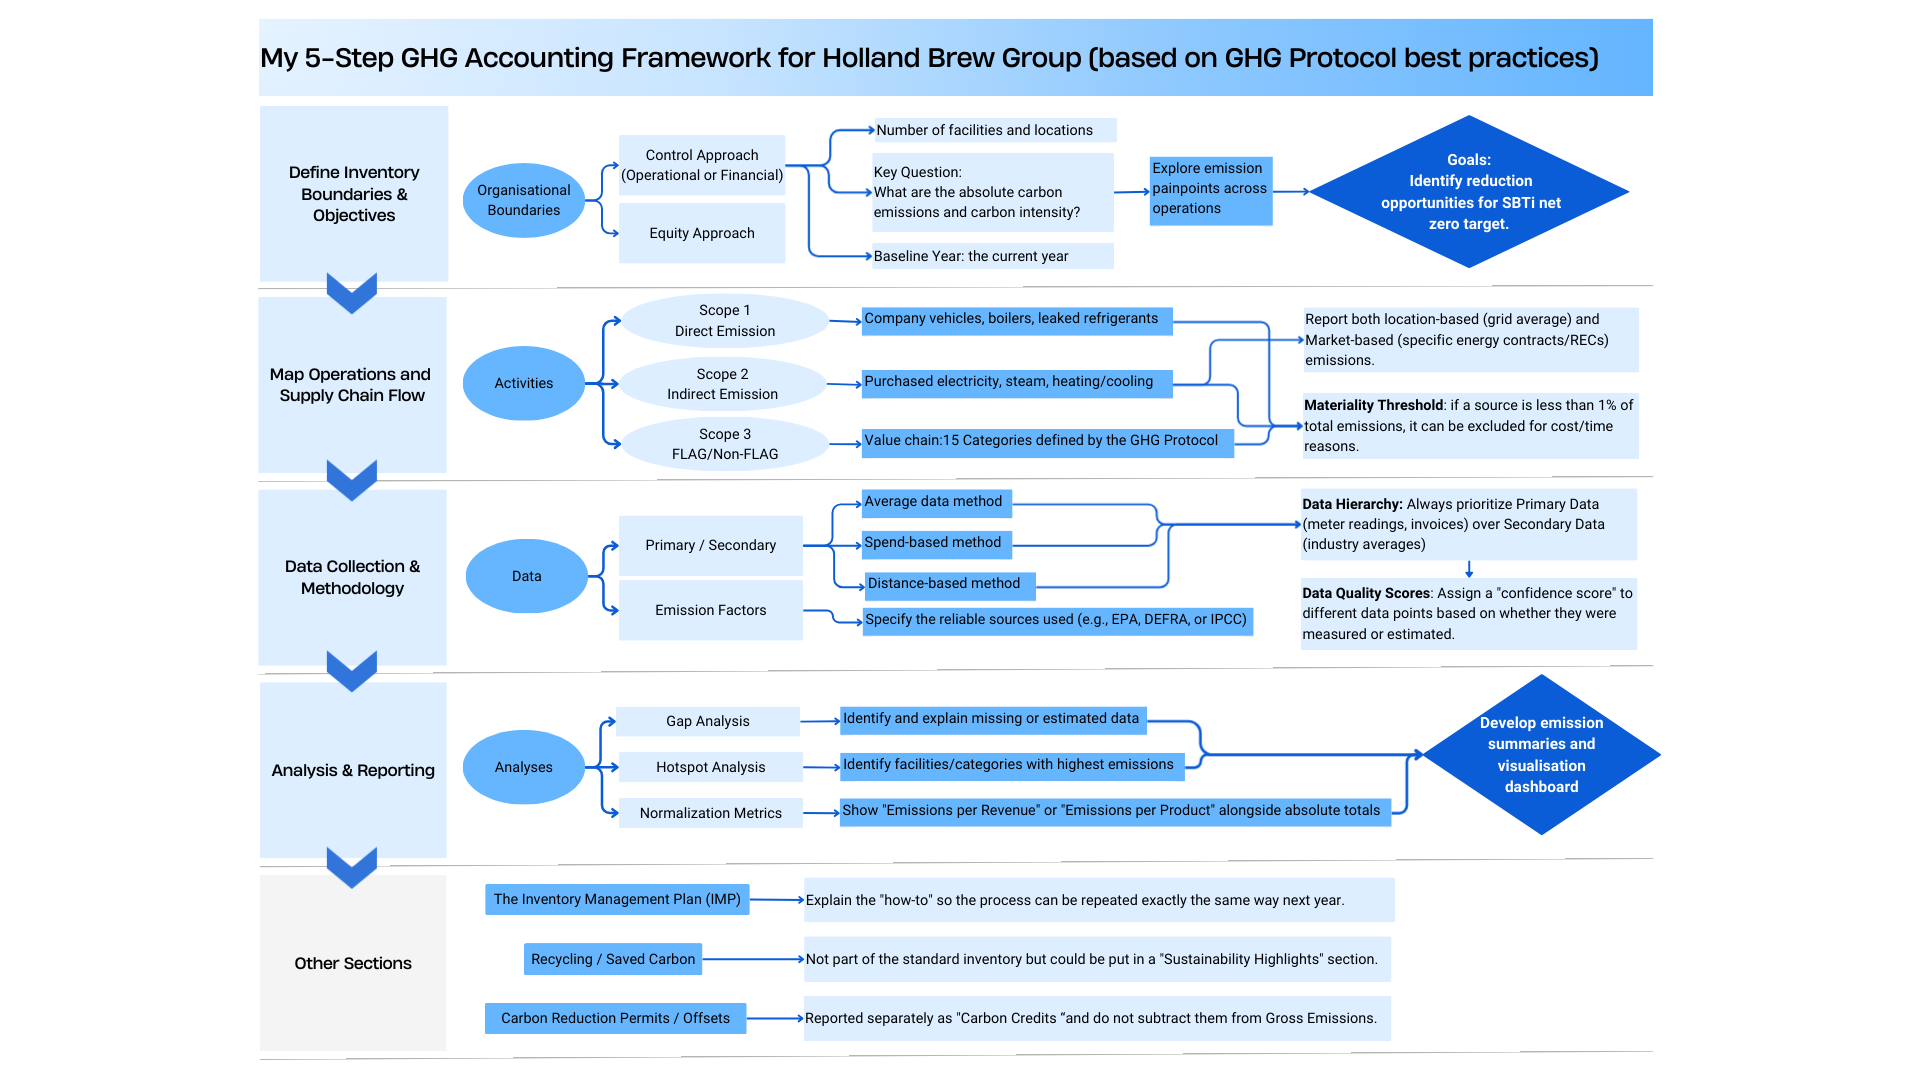
To demonstrate a structured and technically sound application of the GHG Protocol, I developed a five-step carbon accounting framework for this case study, outlined below:
Carbon Emissions Interactive Dashboard
Bridging the gap between technical GHG accounting and strategic action, I developed a Power BI dashboard that transforms raw data into actionable insights. Navigate this interactive tool to explore major carbon pain points and model reduction scenarios, making complex sustainability data accessible and inspiring for decision-makers.
Key Findings:
Total emissions amount to 93.69 ktCO₂e, with Scope 3 dominating at 84.42%, confirming that most impacts occur across the value chain.
Scope 3 Category 1 (Purchased Goods and Services) is the primary hotspot, with drill-down analysis identifies raw coffee bean procurement as the single largest contributor.
A scenario-based What-If model shows that achieving a 42% SBTi-aligned reduction requires lowering emissions to 54.34 ktCO₂e, revealing a substantial target gap.
Hemelingen and Joure Roastery are the highest absolute emitters due to production scale, while high-capacity sites maintain a benchmark carbon intensity of 0.94 kg CO₂e/kg product.
Location-based Scope 2 emissions exceed market-based totals, indicating renewable procurement opportunities.
Scope 3 Category 11 (Use of Sold Products) represents the second-largest emissions segment, driven primarily by brewing energy consumption.
Strategic Recommendations
Meeting the 42% reduction target is not achievable through Scope 1 and 2 reductions alone. Upstream supplier engagement, particularly within Category 1, is essential, requiring supply chain interventions and procurement strategy alignment.
A near-term decarbonisation opportunity exists through renewable electricity procurement in Dutch and German operations to reduce market-based Scope 2 emissions.
Given the materiality of Category 11, the company should explore consumer-facing engagement strategies and energy-efficient product innovation, such as promoting low-energy brewing or “eco-mode” solutions.
Technical Disclosure & Methodology
Data Governance & Assumptions
Synthetic Modeling: All activity data for Holland Brew Group B.V. is synthetic, engineered to reflect the operational profile of a global coffee wholesaler.
Proxy Emission Factors: Factors are modeled after IPCC and IEA benchmarks. This ensures realistic cross-scope magnitudes and identifies hotspots without utilizing proprietary database extracts.
FLAG Scoping: While the SBTi FLAG (>20%) threshold is acknowledged as material for this sector, land-sector removals and specific agricultural modeling were excluded from this initial iteration due to primary data requirements.
Professional Disclaimer
This dashboard is a portfolio exhibit designed to showcase GHG data architecture, ETL processes, and DAX modeling. It represents a point-in-time snapshot and should not be used for investment or policy decisions.